Woolworths: Chase Market Share or Fix the Margin? What Five Years of Public Data Say
Australians spent 17% more at supermarkets between FY2021 and FY2025, but once you take out inflation they actually bought less. Using public Woolworths and ABS data in R, this post works out whether Woolworths gains more from winning market share or from fixing its profit margin, then checks the answer against the FY2026 results.
- r
- ggplot2
- data-analysis
- inflation
- business-case
Disclosure: I work part-time at a Woolworths store. This post uses only public data (Woolworths’ published results and Australian Bureau of Statistics releases). The views are my own and not Woolworths Group’s.
Here’s a number that sounds great: between FY2021 and FY2025, Australians spent 17% more at supermarkets. Here’s the catch: over the same years, food prices went up 20%. Put those two together and the real story flips. Australians didn’t buy more groceries. They bought slightly less and paid more for it.
That one finding ended up shaping the whole question this post tries to answer, which started as a university case study: should Woolworths, Australia’s biggest supermarket, focus on winning more market share, or on fixing its profit margin?
Think of it like running a café. You can try to get more customers through the door (market share), or you can make more profit on every coffee you already sell (margin). Both help. The question is which one is worth more right now, and the data has a surprisingly clear answer.
1. The data: four public files
Everything here comes from files anyone can download:
| File | What it gives us |
|---|---|
| Woolworths Group F25 Five Year Summary (CSV) | Supermarket sales and profit, FY2021 to FY2025 |
| Woolworths Group F26 Five Year Summary (CSV) | The same, FY2022 to FY2026, with the latest restated figures |
| ABS Retail Trade, Australia, Table 11 | Monthly turnover of every supermarket and grocery store in Australia |
| ABS Consumer Price Index, Table 18 | The food price index, to measure inflation |
Woolworths reports its supermarkets under a segment called Australian Food. The ABS file gives the size of the whole market. Dividing one by the other gives an estimate of Woolworths’ market share.
One surprise came up while collecting the data: the ABS stopped publishing Retail Trade after June 2025. It has been replaced by new household spending indicators that are built differently, so they can’t simply be joined onto the old series. That means the market-size figures stop at FY2025. Woolworths’ own numbers go to FY2026, and I use those for the update at the end.
The analysis is in R, using dplyr to clean the data and ggplot2 for the charts.
2. The 17% that wasn’t
The ABS file is monthly, so first I added up each financial year (July to June, so July 2024 to June 2025 is FY2025). Then came the important step: removing inflation.
The idea is simple. If a trolley of groceries cost $100 in FY2021 and $120 in FY2025, a bigger receipt doesn’t mean a fuller trolley. To compare fairly, every year is converted into FY2025 dollars using the food price index:
cpi_2025 <- retail$food_cpi[retail$fy == 2025]
retail <- mutate(retail,
                 real_market = round(market_sales * cpi_2025 / food_cpi))
select(retail, fy, market_sales, food_cpi, real_market)
fy market_sales food_cpi real_market
1 2021 124067.0 81.54 149233
2 2022 128236.3 84.28 149234
3 2023 136577.4 91.37 146607
4 2024 141288.2 95.10 145716
5 2025 145401.0 98.08 145401Read the first and last rows. In plain dollars, the market grew from $124.1 billion to $145.4 billion. In real terms (FY2025 dollars), it shrank from $149.2 billion to $145.4 billion, a fall of about 2.6%.
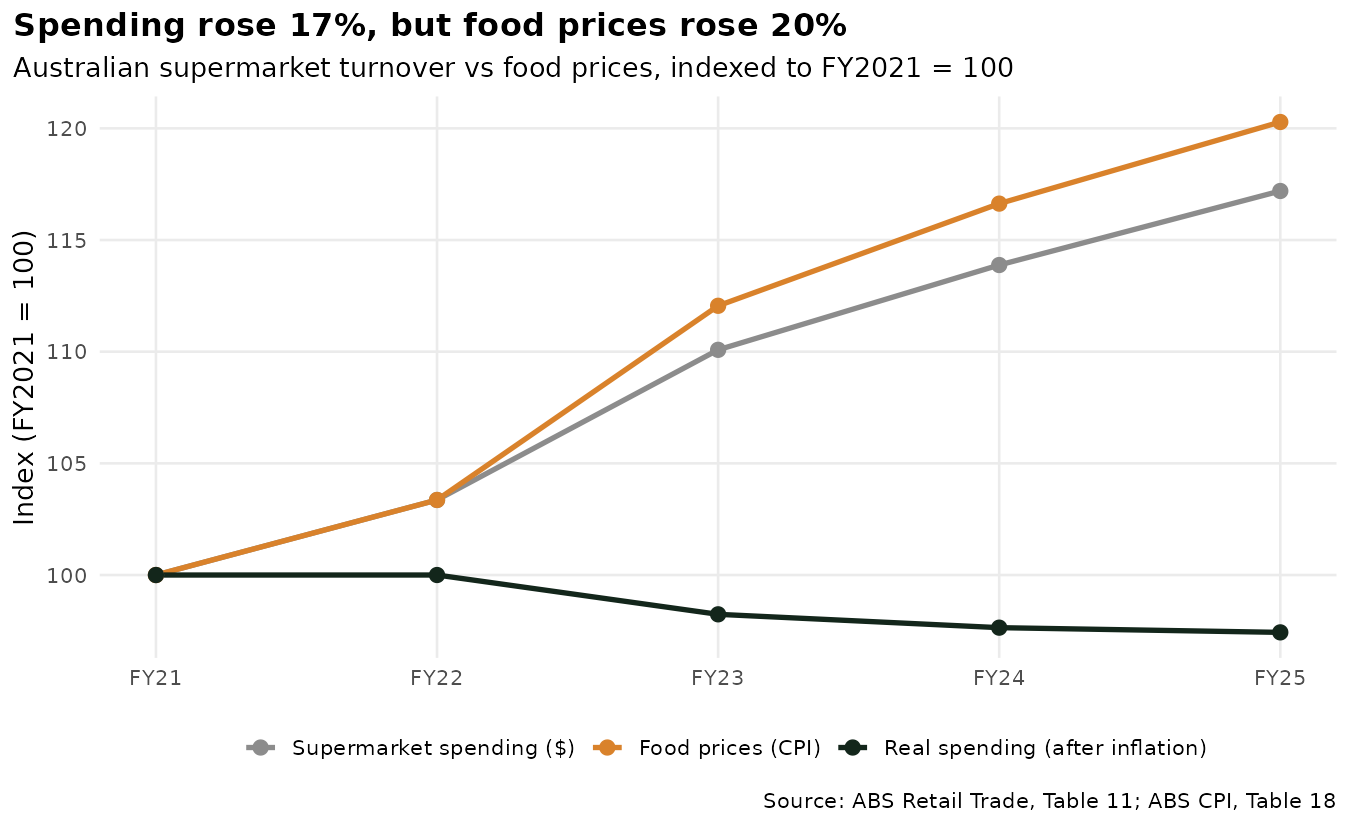
The grey line is what the headlines show. The orange line is prices. The dark line at the bottom is what actually happened to the amount of groceries being bought: flat, then slowly down. All of the “growth” was price.
This matters for the decision. If the market isn’t really growing, the only way to sell more is to take customers from someone else, and that is expensive.
3. Market share: stuck near 35%
Next, Woolworths’ supermarket sales as a share of the whole market:
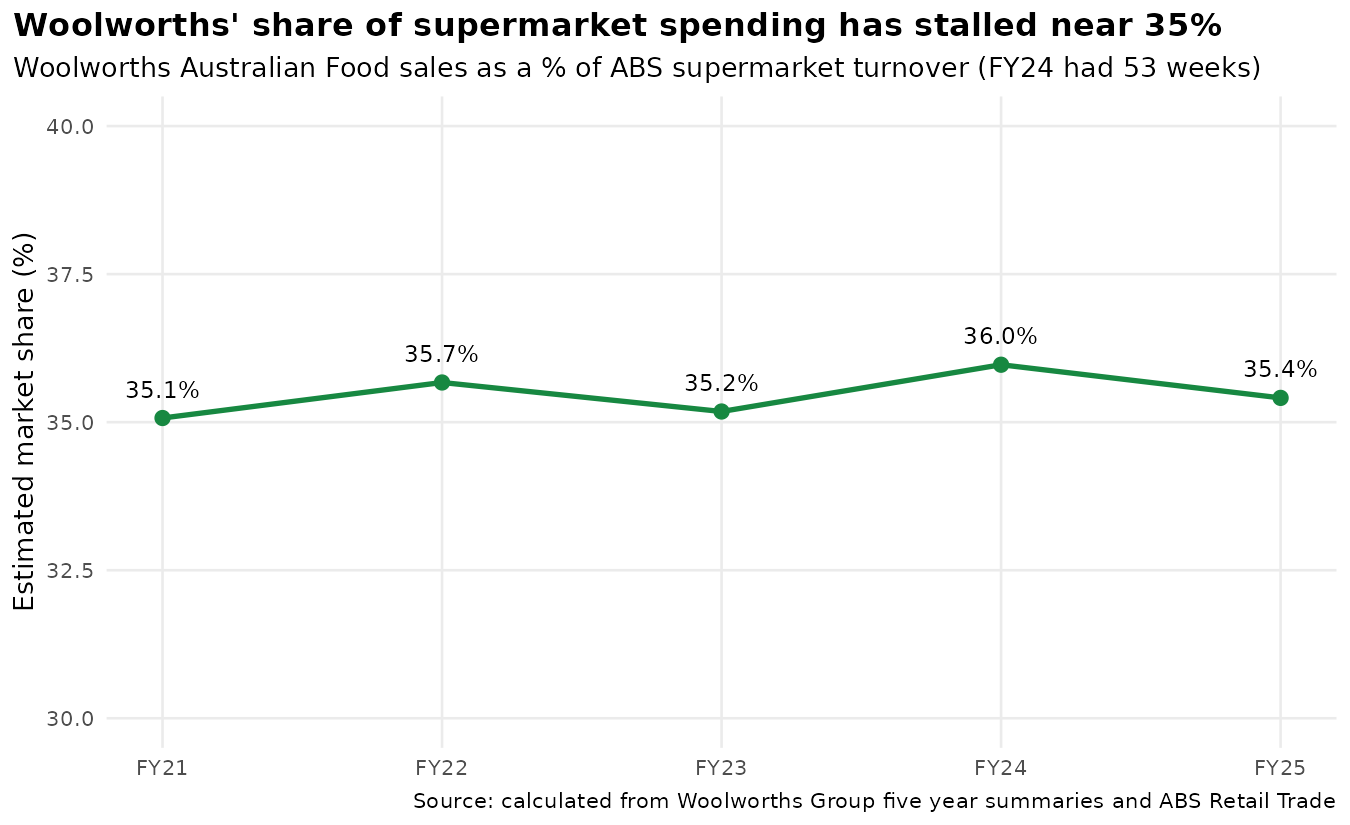
Five years, and the share barely moved: between 35.1% and 36.0% every year. Even the FY2024 high has an asterisk. That financial year had 53 weeks instead of 52 (it happens every few years because of how retail calendars work), so it got an extra week of sales for free. Scale FY2024 back to 52 weeks and FY2025’s sales growth is 3.3%, not the 1.3% the raw numbers show.
A note on the axis: I deliberately set it from 30% to 40%. Zoom in to 35% to 36% and the same data looks like a dramatic rollercoaster, which it isn’t. Share has been flat.
So that’s five years without a real breakthrough on share. Chasing it harder would mean price cuts and promotions in a market that isn’t growing.
4. The margin: a big drop in FY2025
Now the other option. EBIT margin is profit (earnings before interest and tax) divided by sales. In everyday terms: out of every dollar a customer spends, how many cents does Woolworths keep as operating profit?
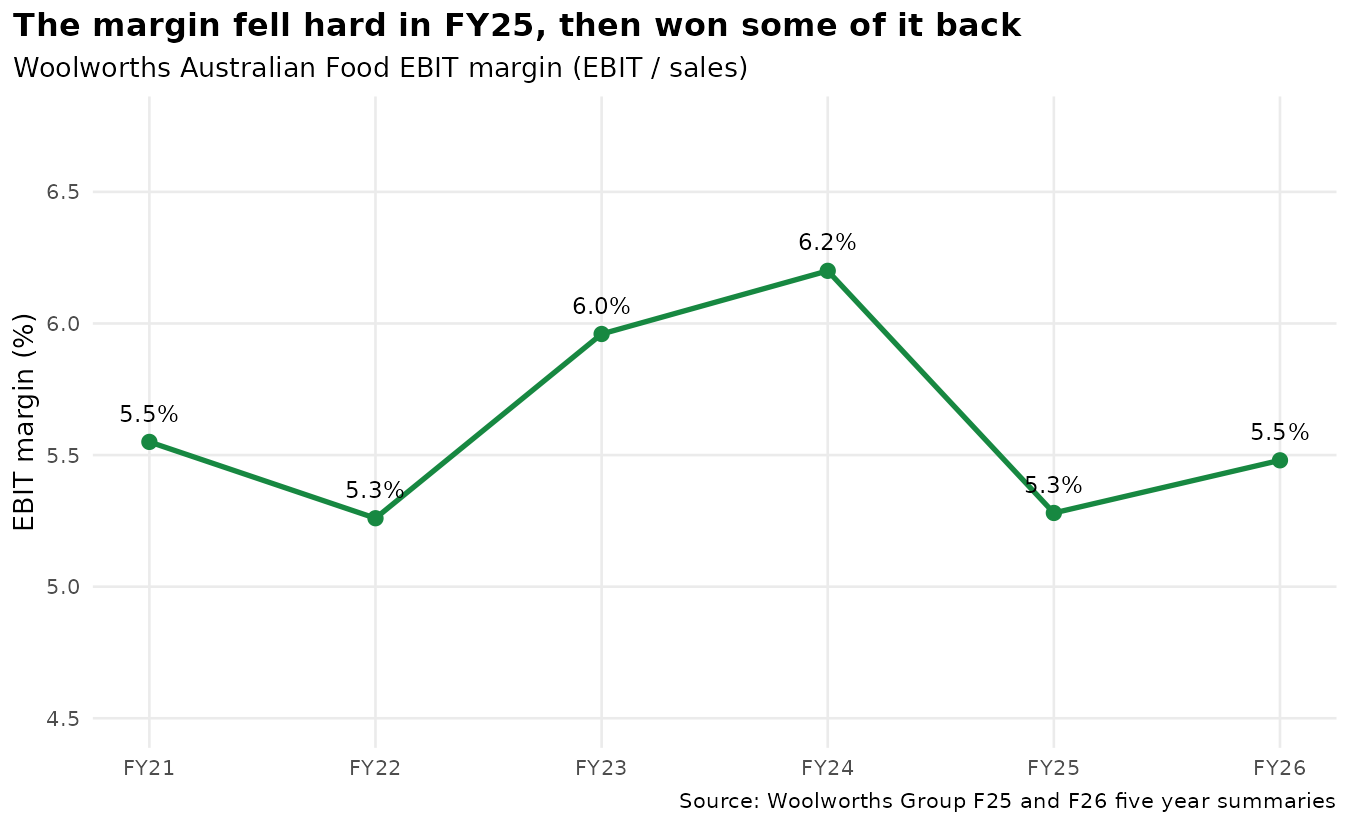
The margin climbed to 6.2% in FY2024, then fell to 5.3% in FY2025. That’s almost a full cent lost on every dollar. A nice property of margin is that inflation doesn’t affect it: profit and sales are measured in the same year’s dollars, so the price effect cancels out.
5. Which one is worth more?
This is the part that decides it. I worked out two numbers, both in yearly profit:
- One extra point of market share. One percent of the FY2025 market is about $1.45 billion of sales. At Woolworths’ FY2025 margin, that’s this much extra profit.
- Getting the FY2024 margin back. The same FY2025 sales, but at 6.2% instead of 5.3%.
gap       <- fy25$wow_sales * (fy24$ebit_margin - fy25$ebit_margin) / 100
one_point <- fy25$market_sales / 100 * fy25$ebit_margin / 100
round(c(margin_gap = gap, one_share_point = one_point, ratio = gap / one_point), 1)
margin_gap one_share_point ratio
473.7 76.8 6.2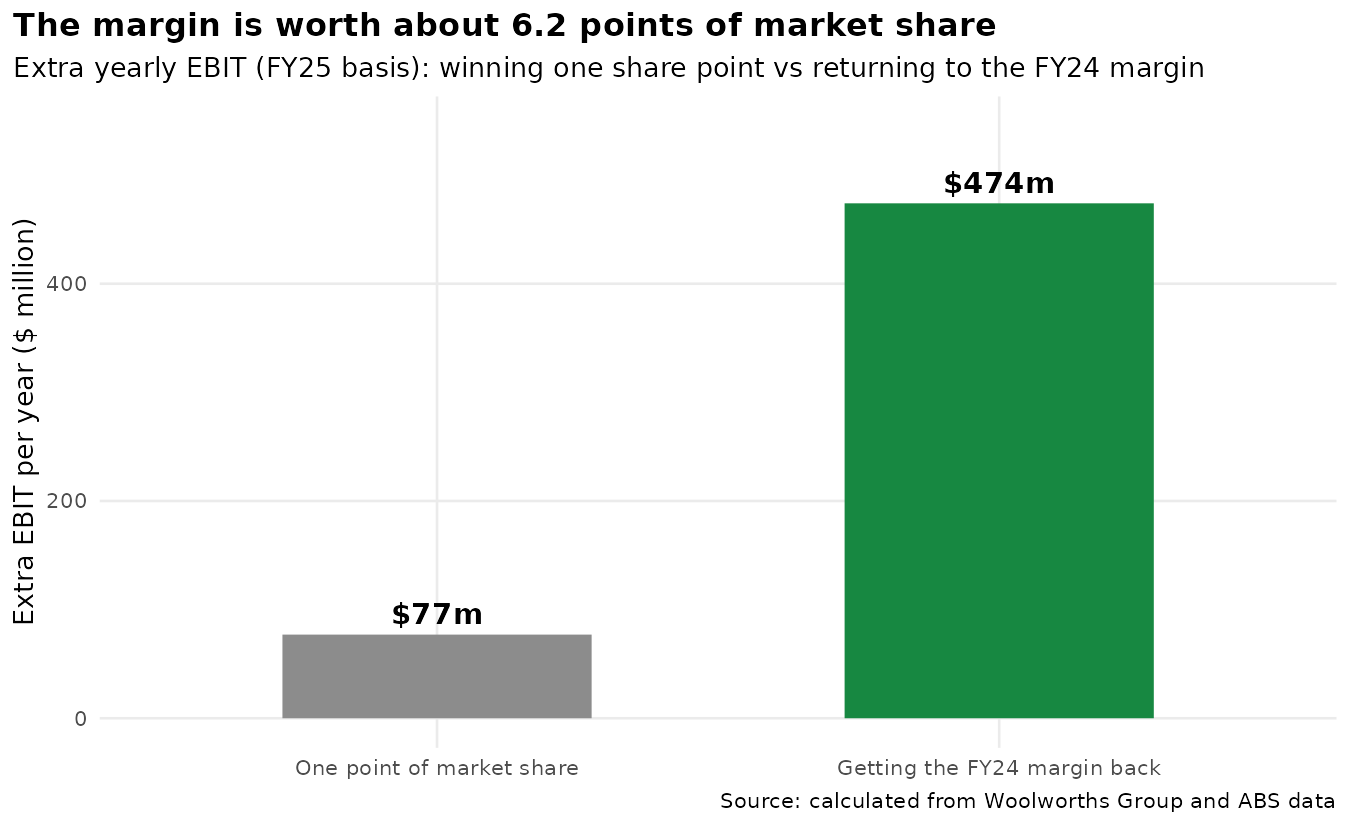
Getting the margin back is worth about $474 million a year. One share point is worth about $77 million. To earn the same from market share, Woolworths would need to win more than six points of share, in a market where it hasn’t gained one point in five years.
That’s why my answer was: fix the margin first. Margin is within the company’s own control (costs, waste, how online orders are picked and delivered, smarter promotions). Market share depends on what competitors do.
6. What happened in FY2026?
My original analysis stopped at FY2025. Since then Woolworths has published its FY2026 results, so here’s how the story moved on:
    fy wow_sales wow_ebit ebit_margin
5 2025     51488     2721        5.28
6 2026 53852 2953 5.48- Sales grew 4.6%. Food prices rose 3.2%, so real sales growth was about 1.4%.
- Profit (EBIT) grew 8.5%, much faster than sales.
- The margin recovered from 5.3% to 5.5%.
So FY2026 moved in the direction this analysis pointed to: profit grew faster than sales, which is what fixing the margin looks like. But it’s only part of the way back. At the FY2024 margin, FY2026 sales would have produced about $388 million more profit. The gap is smaller, but it’s still the biggest lever in the numbers.
(I can’t say whether that improvement came from the reasons I’d have suggested. Public data shows what changed, not why.)
What tripped me up, and the fix
| Problem | What it looked like | How it got fixed |
|---|---|---|
| A label with a hidden space | filter(V1 == "Australian Food") returned nothing | The file actually says "Australian Food ", with a space on the end |
| Numbers stored as text | "51,452" couldn’t be divided | Removed the commas with gsub(), then as.numeric() |
| Weird characters on import | The Woolworths CSV used Windows encoding | Re-saved it as CSV UTF-8 (or read it with fileEncoding = "latin1") |
| Financial years vs calendar years | ABS dates look like "Jul-2024" | July to December go to the next FY, so Jul-2024 becomes FY2025 |
| A 53-week year | FY2024 looked stronger than it was | Scaled FY2024 by 52/53 before comparing growth |
| Restated figures | FY2025 sales were $51,452m in one report and $51,488m in the next | Used the latest report for every year it covers |
| A dataset that ended | ABS Retail Trade stopped in June 2025 | Kept market share to FY2025 and used Woolworths’ own FY2026 numbers for the update |
| Inflation hiding in “growth” | A 17% rise that was all price | Converted every year into FY2025 dollars with the food CPI |
Limitations
- Market share is an estimate. Woolworths’ Australian Food segment and the ABS “supermarket and grocery stores” category aren’t defined in exactly the same way, so the level (about 35%) is approximate. The trend is the useful part.
- The food CPI is a national average. It includes food bought anywhere, not just at supermarkets.
- This is outside-in. It uses only published numbers, with no inside information about why margins moved.
Takeaway
The headline number, 17% growth, was the least useful number in the whole analysis. Once inflation came out, the market was flat to slightly shrinking, and that changed the answer. In a market that isn’t growing, every extra point of share has to be won from a competitor. A cent of margin on every dollar of sales you already have is worth far more and is much more within your control.
The wider lesson for anyone working with data: always ask what a number is measured in. A dollar in 2021 and a dollar in 2025 aren’t the same thing, and treating them as the same would have led to the wrong recommendation.
Sources
- Woolworths Group (2025), F25 Five Year Summary (CSV)
- Woolworths Group (2026), F26 Five Year Summary (CSV), from Reports and Data
- Australian Bureau of Statistics (2025), Retail Trade, Australia, June 2025, Table 11
- Australian Bureau of Statistics, Cessation of the Retail Business Survey and Retail Trade publication
- Australian Bureau of Statistics (2026), Consumer Price Index, Australia, Table 18