Handling Missing Data in Pandas
A real walkthrough of missing data on the Palmer Penguins dataset — finding it, understanding why it's missing, and deciding whether to drop or impute.
- pandas
- data-cleaning
- python
Every dataset so far in this series (Tips) happened to have zero missing values. Real data is rarely that clean. This post uses the Palmer Penguins dataset — 344 penguins across 3 species, with genuine gaps — to work through the actual decision process: find the gaps, understand them, then decide what to do.
1. Load the data
from palmerpenguins import load_penguins

df = load_penguins()
df.shape
(344, 8)Columns: species, island, bill_length_mm, bill_depth_mm, flipper_length_mm, body_mass_g, sex, year.
2. Find the gaps
df.isnull().sum()species 0
island 0
bill_length_mm 2
bill_depth_mm 2
flipper_length_mm 2
body_mass_g 2
sex 11
year 0As percentages (df.isnull().mean() * 100), the four measurement columns are each missing 0.58% of rows, and sex is missing 3.2%. Small numbers, but ignoring them silently would break any model or aggregation touching those columns.
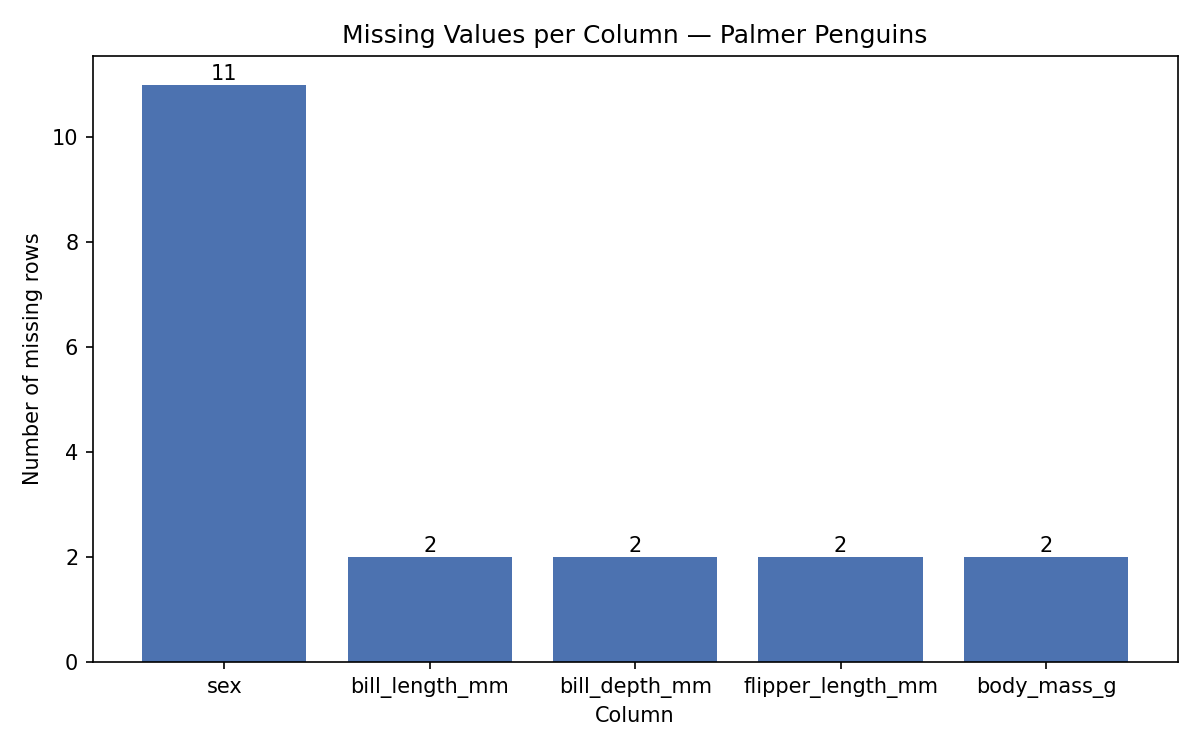
3. Don’t just count — look at the actual rows
df[df.isnull().any(axis=1)]This is the step people skip. Counting missing values tells you how much is missing; looking at the rows tells you why. Here, two rows have every single measurement and sex missing — not partial gaps, completely empty records:
numeric_cols = ["bill_length_mm", "bill_depth_mm", "flipper_length_mm", "body_mass_g"]
df[df[numeric_cols].isnull().all(axis=1)][["species", "island", "sex"] + numeric_cols]
Those 2 rows carry no usable information at all — no amount of imputation recovers a body mass measurement that was simply never recorded. The other 9 rows are missing only sex — species, island, and all four measurements are intact.
That distinction changes the plan: the 2 broken rows get dropped outright, but the 9 rows with just a missing sex are still valuable data for anything not specifically about sex.
4. Drop the unrecoverable rows
df_clean = df.dropna(subset=numeric_cols)
df_clean.shape
(342, 8)dropna(subset=...) only drops rows missing in the listed columns — safer than a bare dropna(), which would drop a row for a missing value in any column, including ones you don’t care about for the analysis at hand.
5. Decide on the remaining gap — don’t default to the mean
9 rows still have no sex. The lazy move is fillna with the most common value:
df_clean["sex"].value_counts()male 168
female 165Nearly a 50/50 split — filling missing sex with “male” (the mode, barely) would silently invent data with no real signal behind it, and would bias any later comparison between sexes. Before deciding, it’s worth checking whether sex actually predicts anything measurable:
import seaborn as sns
import matplotlib.pyplot as plt

sns.boxplot(data=df_clean, x="species", y="body_mass_g", hue="sex")
plt.title("Body Mass by Species and Sex")
plt.show()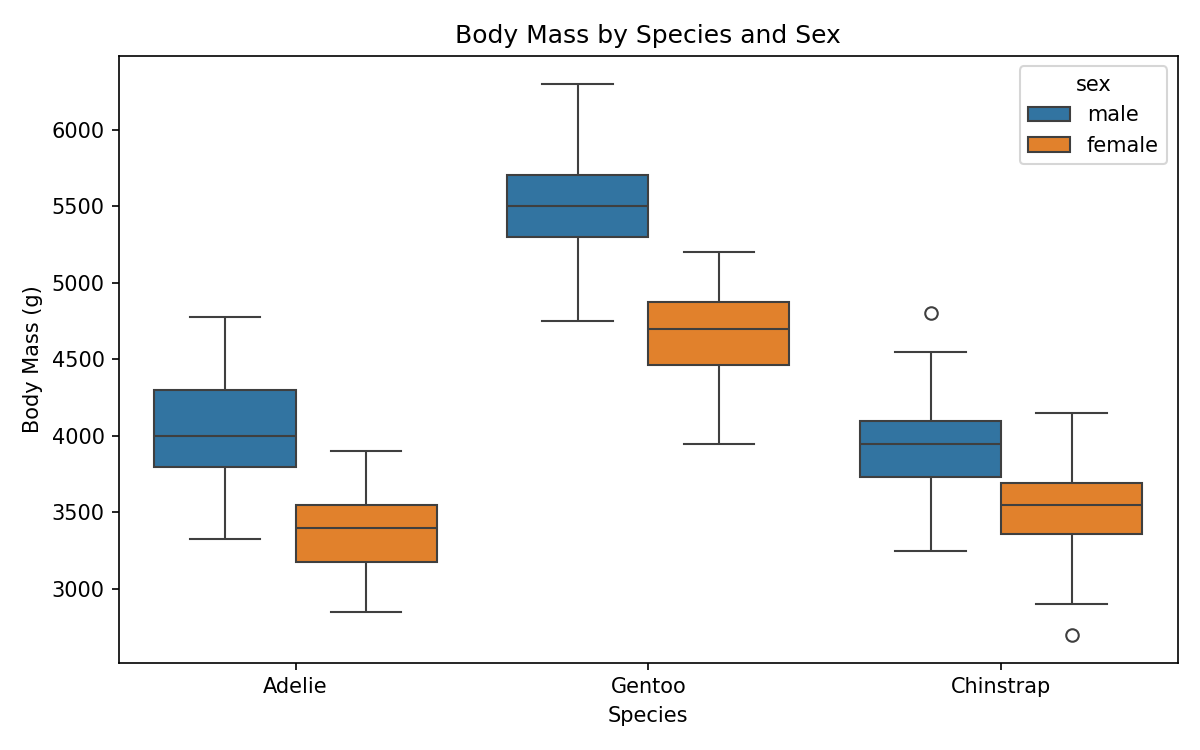
Males and females clearly differ in body mass within each species — so sex is not noise, it’s a real signal. That makes silently guessing it worse, not better. The honest option is to keep it as its own category instead of erasing the gap:
df_clean["sex"] = df_clean["sex"].fillna("unknown")
df_clean["sex"].value_counts()
male 168
female 165
unknown 9Now any downstream grouping or model sees “we don’t know” as its own explicit state, instead of a fabricated guess dressed up as real data.
The decision framework
| Situation | What to do |
|---|---|
| Row has no usable data in the columns you need | Drop it (dropna(subset=...)) |
| Column is missing a small amount and doesn’t correlate with anything meaningful | Impute with mean/median/mode |
| Column is missing and clearly correlates with your target or other variables | Keep the gap visible — a "unknown" category, or a “was this missing” flag column |
| Almost everything in a column is missing | Consider dropping the whole column |
Takeaway
isnull().sum() is the start of the conversation, not the end of it. The real work is looking at which rows are affected, checking whether the missingness is random or tied to something meaningful, and picking drop vs. impute vs. flag on a column-by-column basis — not applying one rule to the whole dataframe.